1
REGISTER
Open a live account and start trading in just minutes.
This site uses cookies to provide you with a great user experience. By visiting monetamarkets.com, you accept our cookie policy.
Allow allThis website is operated by Moneta Markets Ltd, which is not authorised or regulated by the UK Financial Conduct Authority (FCA) and does not offer or promote services to UK residents. Access to this website is restricted in the UK and the content is not intended for distribution to, or use by, any person located in the UK. If you believe you have reached this website in error, please exit the page now
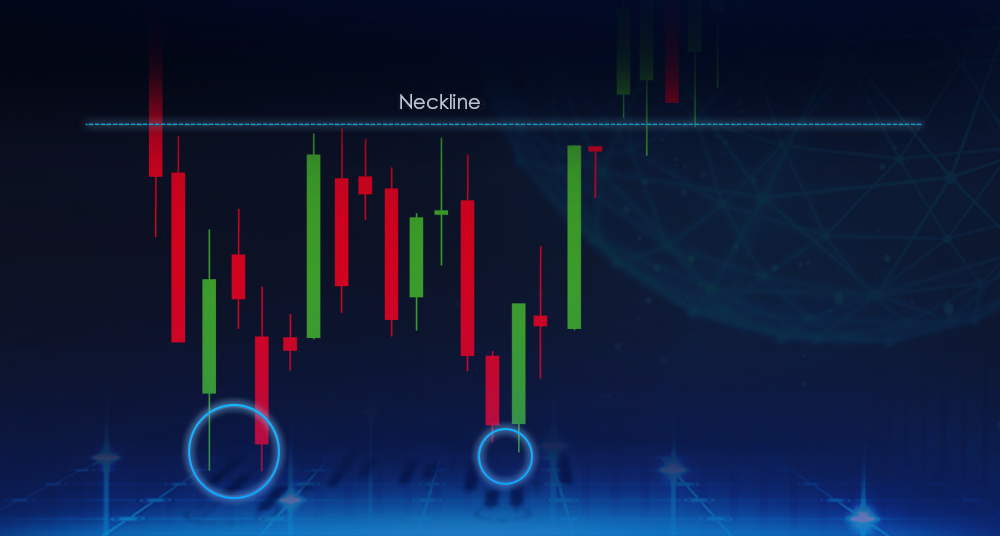
The Double Bottom pattern, and how to use it The double bottom is a bullish chart pattern that is formed by two consecutive troughs at approximately the same price level, separated by a peak. This pattern is created when the …
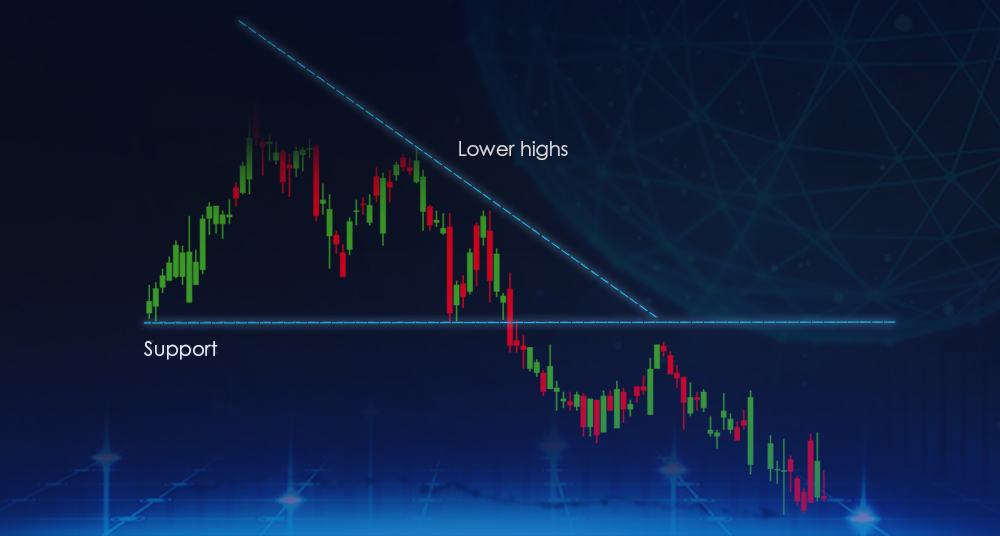
The Descending Triangle pattern, and how to use it The descending triangle is a bearish chart pattern that is formed by a horizontal support level and a downward sloping resistance level. This pattern is created when the price of an …
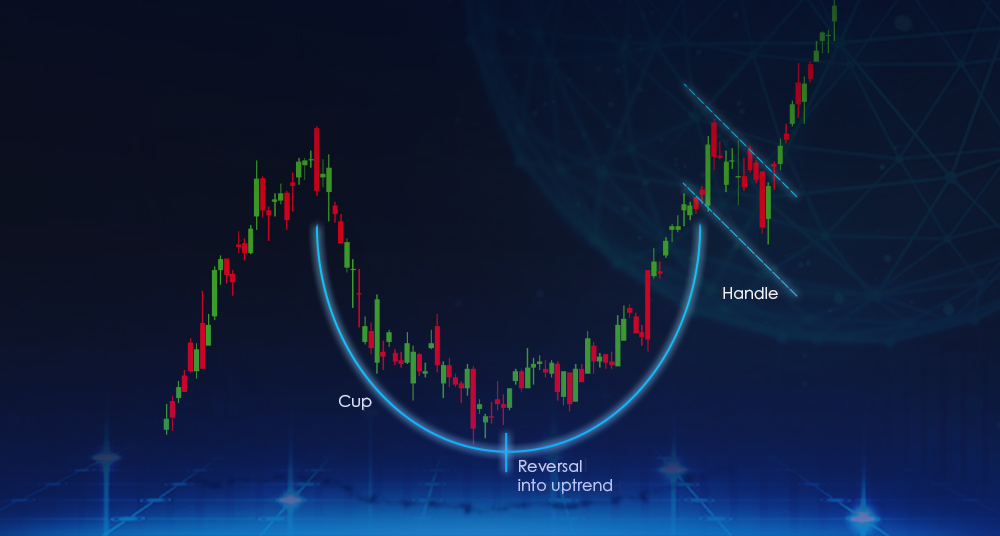
The Cup And Handle pattern, and how to use it The cup and handle is a chart pattern that is formed by a “cup” shaped pattern and a subsequent “handle” that looks like a small flag or triangle. This pattern …

The Bullish Triangle pattern, and how to use it The bullish triangle is a chart pattern that is formed by a horizontal support level and an upward sloping resistance level. This pattern is created when the price of an asset …

The Bullish Pennant pattern, and how to use it The bullish pennant is a chart pattern that is formed by an upward sloping resistance level and a converging support level. This pattern is created when the price of an asset …

The Bullish Flag pattern, and how to use it The bullish flag is a chart pattern that is formed by an upward sloping resistance level and a horizontal support level. This pattern is created when the price of an asset …

The Bearish Triangle pattern, and how to use it The bearish triangle is a chart pattern that is formed by a horizontal resistance level and a downward sloping support level. This pattern is created when the price of an asset …
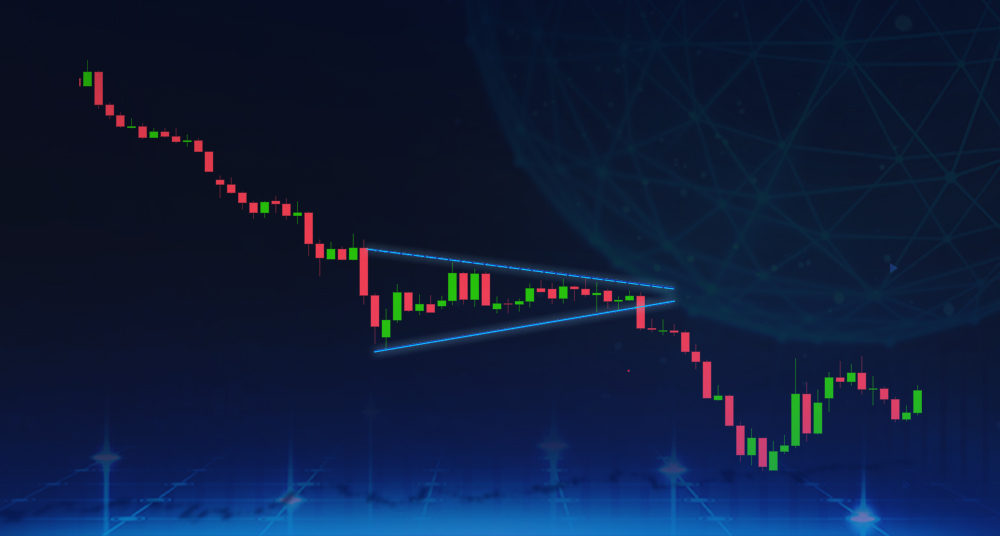
The Bearish Pennant pattern, and how to use it The bearish pennant is a chart pattern that is formed by a downward sloping resistance level and a converging support level. This pattern is created when the price of an asset …

The Bearish Flag pattern, and how to use it The bearish flag is a chart pattern that is formed by a downward sloping resistance level and a horizontal support level. This pattern is created when the price of an asset …
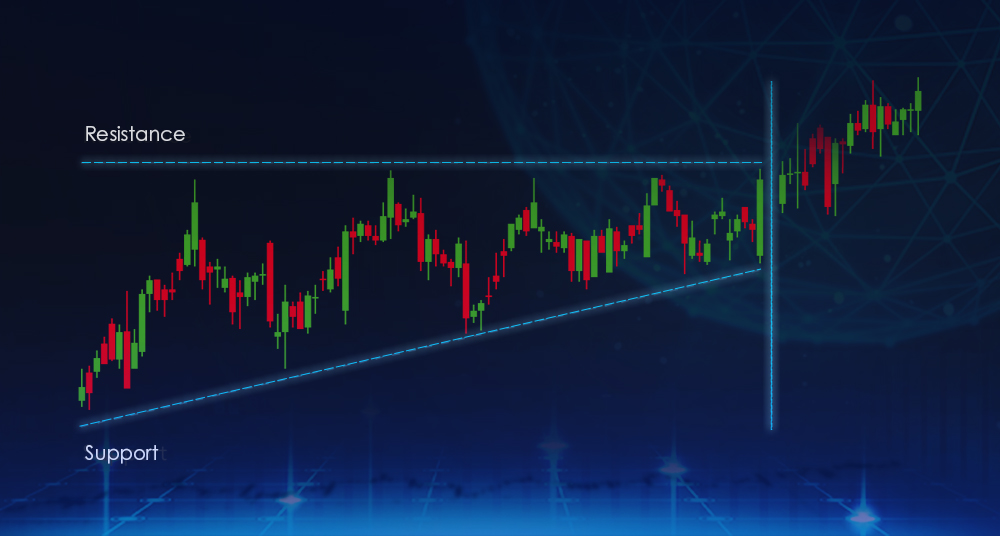
The Ascending Triangle pattern, and how to use it The ascending triangle is a bullish chart pattern that is formed by a horizontal resistance level and an upward sloping support level. This pattern is created when the price of an …
Open a live account and start trading in just minutes.
Fund your account using a wide range of funding methods.
Access 1000+ instruments across all asset classes