This site uses cookies to provide you with a great user experience. By visiting monetamarkets.com, you accept our cookie policy.
Allow allThis site uses cookies to provide you with a great user experience. By visiting monetamarkets.com, you accept our cookie policy.
Allow all
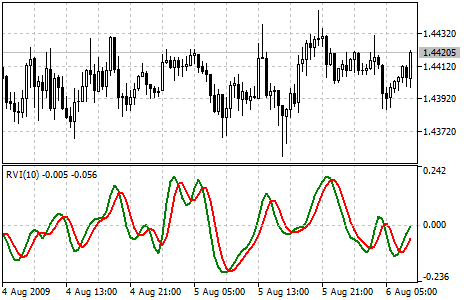
The Relative Vigor Index (RVI) is a technical analysis tool that traders use to identify potential buying and selling opportunities based on changes in market momentum. The RVI is a variation of the popular relative strength index (RSI) indicator, but instead of using price changes to measure momentum, it uses the closing price and the opening price of each period to calculate the RVI value. The RVI is displayed as a line on a separate window below the main price chart and ranges from 0 to 100.
Traders typically use the RVI to identify potential buying and selling opportunities based on changes in market momentum. The RVI is a momentum oscillator, which means that it fluctuates above and below a centerline, with values above the centerline indicating bullish momentum and values below the centerline indicating bearish momentum. Traders can use the RVI to confirm the strength of a trend or to identify potential trend reversals. For example, if the RVI is above the centerline and rising, this may be an indication that the trend is gaining strength and may continue. On the other hand, if the RVI is below the centerline and falling, this may be an indication that the trend is losing momentum and may reverse.
To add the RVI to a chart in MetaTrader 4 (MT4) or MetaTrader 5 (MT5), follow these steps: